Celigo Error Management
Integratorio has the ability to turn on the Debug Logs after connection level, so that we can see the request and responses that are going through the connection. This works on http based connections within integratorio. Let us move to the connections in the integratorio.
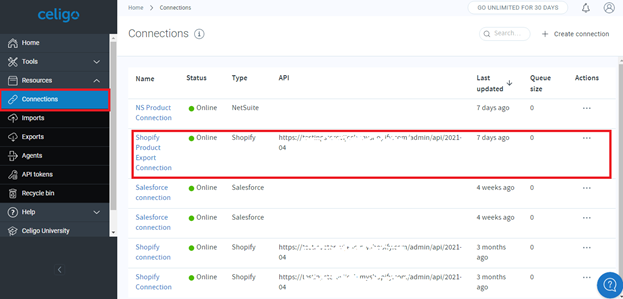
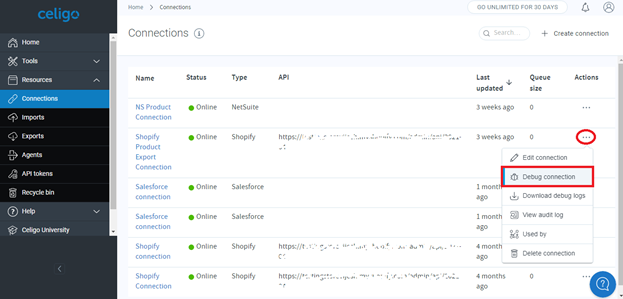
Now select the connection to which we need to turn on the debug logs for.
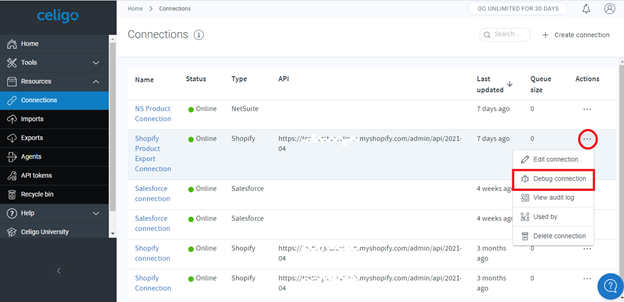
The bug icon highlighted allows us to configure the debugger.
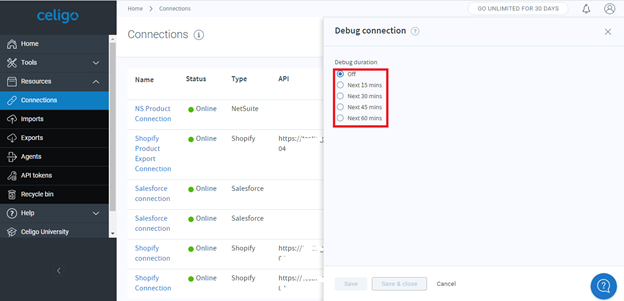
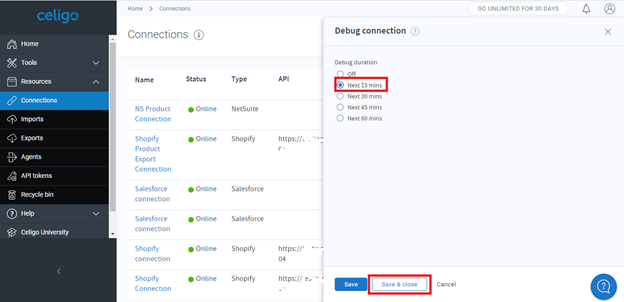
Clicking on the debugger pops up a window where we can select the duration of the debugger. Here we have 15 minutes ,30 minutes ,45 minutes , 60 minutes. The debugger does not stay on indefinitely, and only logs the information that happens when the debugger is turned on. Let us take the debugger to be turned on for 15 minutes by selecting the 15 mins option and hit the Save or Save & Close button.
Now, anything that happens through that connection will be logged within those debug logs. So these logs may contain all the exports and imports using that connection, the data being transferred through that will be logged. Sensitive information like passwords will not be logged.
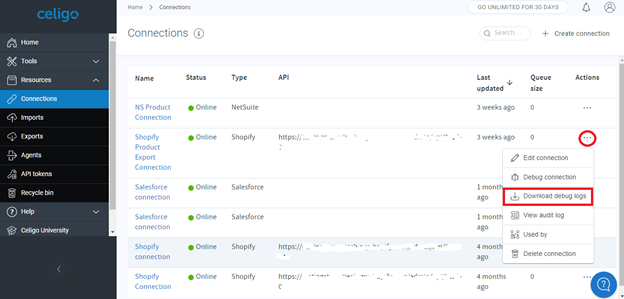
To view the logs come back to the connection and select the option for which we have turned on the debugger and hit the Download debug logs so that we can view the logs offline.
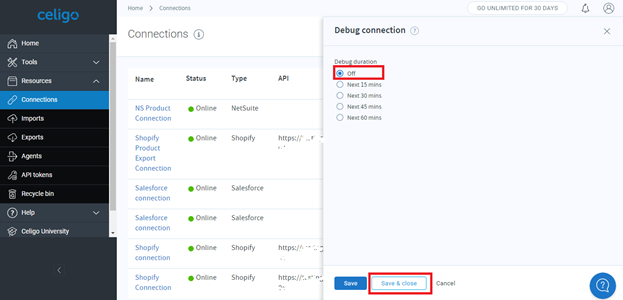
We can turn off the debugger or extend the time. The step is the same as we have done to turn the debugger on.
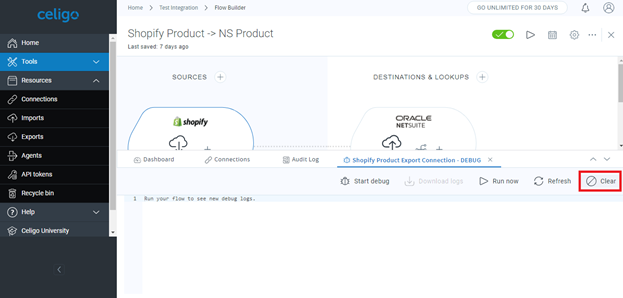
We can also do the debugger during the flow builder. Let us go back to home
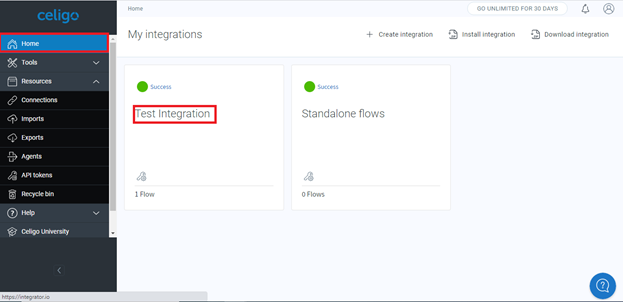
Open any of the flow from any integration. Here we can select the flow Shopify Product -> NS Product from the integration Test Integration. When we open the flow, in the Connection subtab we can see the connection used for that flow. In the option select the Debug connection
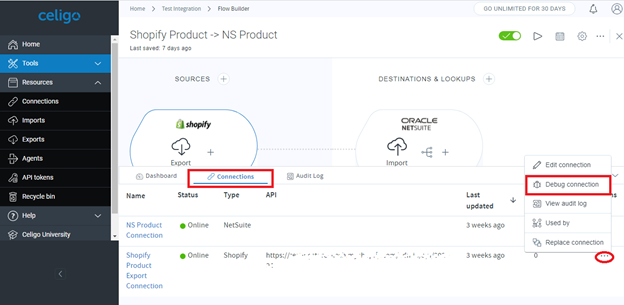
When we select the Debug connection it will open a new subtab where we can view the logs that are going through this connection.
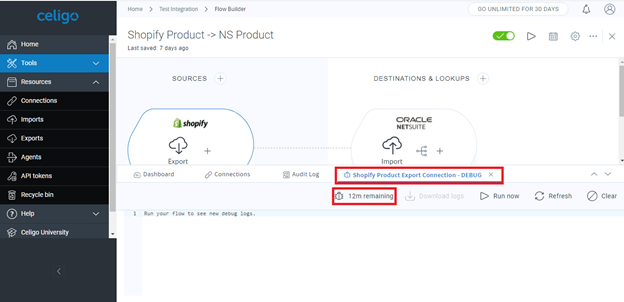
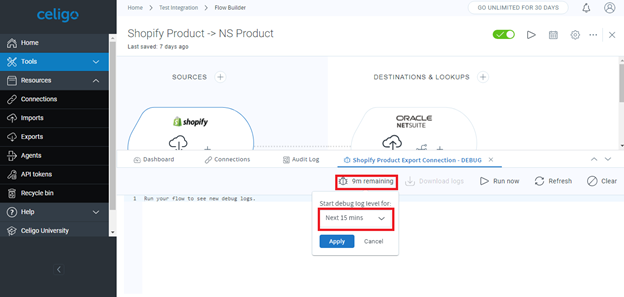
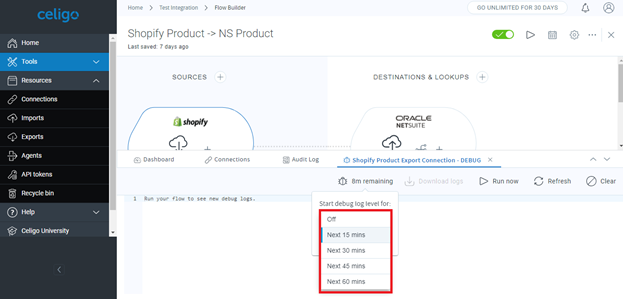
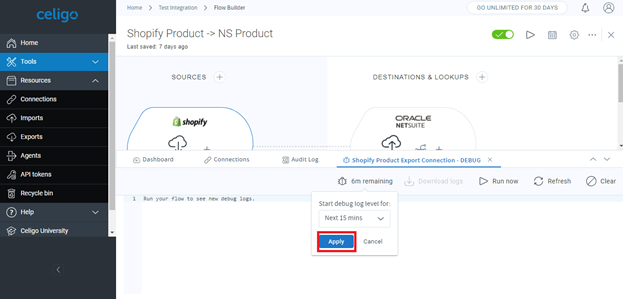
Here we can see a bug icon , where we can also see how much time is remaining for the debugger when the debugger is already started, else it will show Start debug. When we click the bug icon we can change the duration of the debugger or even turn off the debugger and hit Apply.
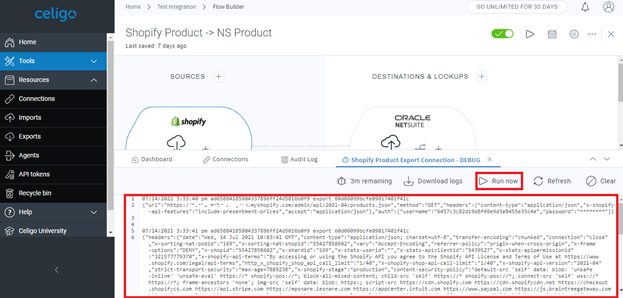
To view the logs we need to run the flow by clicking Run now.
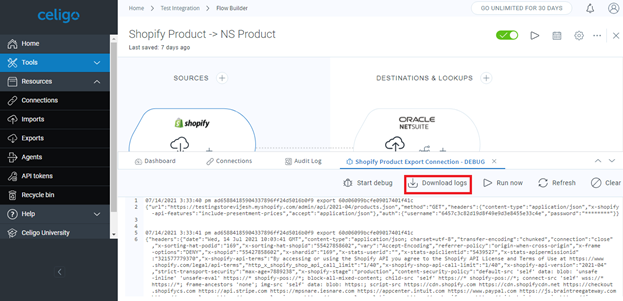
We can also download the log by clicking Download logs, which helps us to see the logs even if we are offline.
We can refresh the logs by clicking Refresh to get the latest logs.Latest log will be always at the bottom and the oldest will be at the top. In the log, we can see what request has been made including the URL, the body and the headers .
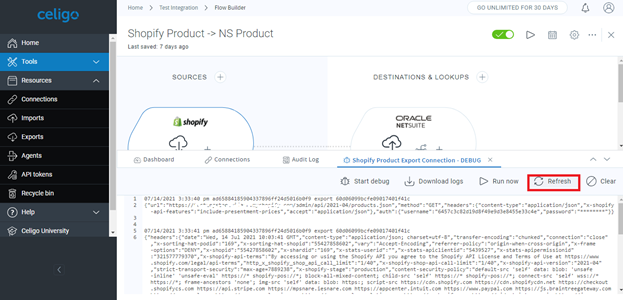
We can clear the log by clicking Clear.